Choosing the right Business Intelligence tools

Faced with spiralling data costs, organisations need to take a strategic approach to storing, deleting and using their data.
Globally, the total amount of data created, captured, copied and consumed is expected to top 120 zettabytes in 2023(1). At the same time, more than half of UK IT decision-makers say data storage costs are “unsustainable”(2).
The UK business data survey found that most businesses with 10 or more employees collect some form of digitalised data(3). Excluding data collected from employees, 65% of UK businesses collect personal data and 50% collect non-personal data.
Simply put, Business Intelligence is about making that data work for the benefit of your organisation.
What is Business Intelligence?
Business Intelligence (BI) is defined as “a technology driven process for analysing and delivering actionable information that helps executives, managers and workers to make informed business decisions.”
To achieve this, a combination of data storage, data management, analytics and reporting tools will be used. Of course, the overall business intelligence strategy may look very different from one company to another – it will be driven by the type and quantity of data the business holds and how it defines success (and, therefore, which metrics are important).
For example, financial services firms might use BI for risk analysis, sales optimisation and customer relationship management. Meanwhile, manufacturing companies might use BI for performance monitoring and resource optimisation. Even within an organisation, different departments will have different requirements from their data and their business intelligence tools. Marketing will want information about response rates and conversion costs. HR might want to track the impact of various benefits and interventions on retention.
For this reason, the first step of any Business Intelligence initiative is to understand what success looks like for your organisation and which metrics are required to track and improve on that success.
The data foundation of Business Intelligence
The quantity, quality and distribution of the data you hold within your organisation will determine the complexity of and investment required for a suitable data platform for your BI initiatives.
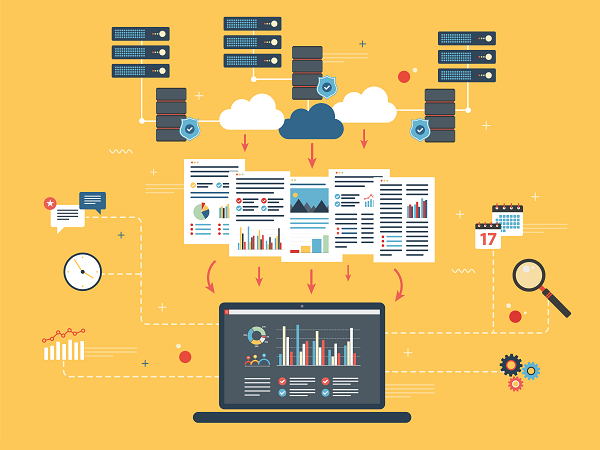
If you hold a lot of data in silos of information and myriad of systems, pulling all your data into a data lake is probably going to be a necessary first step. And, as part of that first step, cleaning and consolidating your data before it enters the data lake is a valuable way to ensure data quality and reduce storage costs. Tools such as Microsoft Dynamics Customer Insights, for example, offer an opportunity to implement master data management strategies to ensure consistent data quality.
Traditionally, data warehouse solutions were often built as on-premises solutions. This creates security, backup and recovery, scaling and rising cost challenges. As a result, Gartner has found that most new BI spending is for cloud-based projects.
Cloud storage offers an opportunity to scale efficiently, with different options for “hot”, “cold” and “archive” storage, as well as capacity to add bursts of compute power when required, e.g. for data analysis. Further, cloud data centres offer advanced security. Plus, opting for established cloud platforms like Microsoft Azure offers opportunities to use automated tools and to access advanced technologies such as AI tools for querying, automated management and easier retrieval of archival data.
But while building an Azure Data Lake is fine for larger organisations, for smaller organisations which hold a limited amount of data it isn’t going to be cost-effective. Instead, such organisations might choose to present data directly to users from your CRM or Finance system, for example.
The analysis and presentation of your Business Intelligence
It used to be that IT and data analytics teams would be employed to understand business reporting needs and then create the required reports. This could be a lengthy and frustrating process for users, with “real time” often being an alien concept.
Today, there are a plethora of BI dashboard tools that put the ability to query and present data firmly in the hands of business users.
This doesn’t mean that there is no longer a role for specialist data analytics and reporting teams – but their advice and expertise can be better deployed in supporting your business users to use the new no-code and low-code BI tools effectively.
Microsoft’s Power BI, part of its Power Platform, is one such tool that enables non-technical users to query business intelligence data and to create data visualisations and business intelligence dashboards. It’s easy to use and comes with a vast array of connectors, making it easy to incorporate your business data sources.
In November 2022 alone, Microsoft added six new connectors(4) to offer 45 native connectors for files, relational databases, data warehouses, line of business applications, SaaS providers, OLAP systems, cloud storage systems, web sources, social networks and big data.
This makes Power BI as useful for smaller organisations who might want to pull in data directly from their social apps, CRM systems or finance applications as it is for larger organisations who want to create their Power BI dashboards based on data from their Microsoft Dataverse or Azure cloud or other enterprise data storage solutions.
Getting started with Business Intelligence
While ensuring that the data you are using for your business intelligence is clean and accurate is important, it isn’t always advisable to embark on lengthy data cleaning and consolidation exercises or initiatives to make data more “complete” prior to beginning a BI project.
Yes, you need quality. You can’t make good decisions on bad or incomplete data.
However… presenting business data in an engaging and accessible way to business users can help to drive data improvement across the organisation. People begin to understand the importance of inputting clear and accurate data when it is presented back to them.
Or, to look at it another way, if data simply disappears into a black hole once it is entered into your business systems, there is no incentive to business users to ensure the quality of that data.
Further, business users will be inspired to think “if only we had XX information” or “if only we could cross-reference this with XX”. This way, opportunities to expand the sources of data used for your BI is driven by user need. And the connectors available within Power BI, for example, make it easy to add new data sources.
In our experience, taking this type of agile, iterative approach is a good way to get started with a business intelligence programme.
What next?
Do you aspire to use data better within your own organisation?
Talk to the Grant McGregor team today to discuss your aspirations, the tools available and how we might assist.
Call us: 0808 164 4142
Message us: https://www.grantmcgregor.co.uk/contact-us
Further reading
Find more information on the Grant McGregor blog:
• What should a cloud migration strategy look like in 2022?
• Tips for getting the most from Power Platform
• What Is Citizen Development? And Should You Be Doing It?
• What does the EU’s new Digital Services Act mean for your business?
Sources:
1. https://www.statista.com/statistics/871513/worldwide-data-created/
2. https://techmonitor.ai/technology/data/data-storage-costs-uk-it
3. https://www.gov.uk/government/statistics/uk-business-data-survey-2022/uk-business-data-survey-2022--2
4. https://powerbi.microsoft.com/en-us/blog/power-bi-desktop-expanding-list-of-enterprise-data-connectors/


